Introduction
Pakistan's agricultural sector is facing an unprecedented crisis. Farmers across Punjab, Sindh, Balochistan, and Khyber Pakhtunkhwa are struggling daily with crippling electricity shortages, skyrocketing energy costs, depleting water resources, and unpredictable climate patterns. These challenges threaten not only individual farm profitability but also the nation's food security.
Yet, within this crisis lies an extraordinary opportunity. Pakistan receives over 300 sunny days annually, making it one of the world’s most solar-rich nations. This abundant sunshine, combined with dramatically declining solar technology costs, creates perfect conditions for solar adoption in agriculture. Forward-thinking Pakistani farmers are discovering that integrating solar energy isn’t just environmentally responsible it’s economically essential for survival and competitive success.
This comprehensive guide provides Pakistani farmers with practical, actionable strategies for integrating solar panels into their agricultural businesses. From understanding your farm's energy needs to selecting appropriate equipment, planning installations, and maximizing long-term returns, you’ll find everything needed to transform your farm through solar power.
The future of Pakistani agriculture is solar-powered. Let’s explore how your farm can be part of this transformation.
The Energy Crisis Impacting Pakistani Agriculture
Understanding the full scope of Pakistan's agricultural energy crisis reveals why solar integration has become necessary rather than optional.
Load Shedding Devastates Crops and Incomes
Rural Pakistan experiences 8-16 hours of daily load shedding during peak summer months precisely when irrigation demands are at their highest. This is not just an inconvenience; it's an agricultural catastrophe in slow motion.
Consider a wheat farmer in Punjab whose crop enters the critical grain-filling stage in March. Each day without irrigation during this period reduces potential yield by 2-3%. A week of irrigation failure entirely possible during peak load shedding can slash yields by 20-30%. For a farmer cultivating 20 acres, this translates to losses of Rs. 200,000-400,000 from a single load-shedding episode.
Cotton farmers face similar devastation. The flowering and boll-formation stages require consistent moisture. Load shedding during these critical periods causes flower drop and boll shedding that no subsequent irrigation can reverse. Farmers watch helplessly as potential harvests wither in the fields while they wait for electricity that never arrives.
Vegetable growers experience the most immediate impacts. Tomatoes, chilies, and cucumbers require daily irrigation during hot months. Missing even two consecutive days causes irreversible wilting, fruit drop, and quality deterioration. A single week without power can destroy an entire crop worth Rs. 500,000 or more.
Electricity Costs Consume Farm Profits
When electricity is available, its cost increasingly exceeds what farming economics can bear. Agricultural tariffs have risen dramatically over recent years, now reaching Rs. 25-40 per unit depending on the connection type and region.
Consider the mathematics facing a typical Punjab farmer running a 10-horsepower tube well:
-
Motor consumption: 7.5 kW
-
Daily operation: 6 hours during irrigation season
-
Daily consumption: 45 kWh
-
Daily cost at Rs. 30/unit: Rs. 1,350
-
Monthly cost (25 irrigation days): Rs. 33,750
-
Seasonal cost (5 months): Rs. 168,750
This represents electricity expenses alone—not including motor maintenance, starter repairs, or wiring costs. For many farmers, electricity bills consume 30-50% of gross crop revenue, leaving inadequate margins for inputs, family expenses, and farm improvements.
The situation worsens annually as tariffs increase. What cost Rs. 100,000 annually five years ago now costs Rs. 200,000 or more. Farmers cannot increase crop prices proportionally since market forces set commodity values. The squeeze between rising costs and stagnant revenues threatens farm viability across Pakistan.
Diesel Dependence Proves Equally Unsustainable
Many farmers rely on diesel generators or diesel-powered tube wells during load shedding. This supposed solution creates its own crisis.
Diesel prices have exceeded Rs. 300 per liter with frequent increases. A 10-horsepower diesel engine consumes approximately 3-4 liters per hour. Daily diesel costs for six hours of pumping range from Rs. 5,400-7,200. Monthly expenses during the irrigation season exceed Rs. 135,000-180,000.
These costs exceed grid electricity by 3-5 times while providing the same service. Farmers essentially pay premium prices for the privilege of irrigating their own crops. For many, diesel expenses exceed total crop revenues, making farming economically irrational yet socially necessary.
Beyond direct costs, diesel engines require constant maintenance. Oil changes, filter replacements, injector cleaning, and periodic overhauls add Rs. 30,000-50,000 annually. Breakdowns during critical irrigation periods often occurring precisely when engines work hardest cause crop losses exceeding repair costs.
Environmental and health impacts compound economic burdens. Diesel exhaust pollutes the farm air, affecting farmer health and crop quality. Noise disturbs livestock and poultry, reducing animal productivity. Fuel spills contaminate soil and groundwater. These hidden costs rarely appear in farm accounts but diminish quality of life and long-term farm value.
Remote Areas Face Impossible Economics
Countless Pakistani farms lack grid electricity entirely. Extending WAPDA or K-Electric lines to remote fields costs Rs. 500,000-2,000,000 per kilometer, depending on terrain and infrastructure requirements. For farmers with land several kilometers from existing lines, connection costs exceed land values.
Even when technically possible, utilities prioritize urban and industrial connections over agricultural extensions. Farmers may wait years for approved connections that never materialize. Meanwhile, their land remains unirrigated or depends on expensive diesel pumping.
This infrastructure gap particularly affects Balochistan, interior Sindh, and remote Punjab areas where agricultural potential remains unrealized. Productive land sits fallow because pumping groundwater costs more than crops can generate. Solar technology eliminates this barrier entirely.
Water Table Decline Compounds Energy Challenges
Groundwater levels across Pakistan's agricultural heartland drop 1-3 meters annually. The Indus Basin aquifer that sustains Punjab and Sindh agriculture faces severe depletion. What once required 50-foot tube wells now demands 150-foot or deeper installations.
Deeper pumping requires more powerful motors consuming more electricity. A farmer whose 5-horsepower motor adequately served a shallow tube well now needs 10 or 15 horsepower for the same water volume from greater depths. Energy consumption doubles or triples while water extraction remains constant.
This vicious cycle accelerates as more farmers drill deeper, collectively draining aquifers faster. The agricultural model that built Pakistan's food production now undermines its own foundation. Sustainable water management through efficient irrigation becomes essential and solar power enables the technologies that make efficiency possible.
Pakistan's Extraordinary Solar Advantage
Against the backdrop of this crisis, Pakistan possesses natural advantages that make solar integration exceptionally attractive for agriculture.
World-Class Solar Resources
Pakistan receives average solar irradiance of 5-7 kWh per square meter daily significantly exceeding European countries that lead global solar adoption. Germany, a solar energy leader, receives only 2.5-3.5 kWh/m²/day. Pakistan's solar resource is literally twice as productive.
Regional variations exist within Pakistan, but all areas receive excellent sunshine:
-
Balochistan receives Pakistan's highest solar radiation at 6-7 kWh/m²/day. The province’s clear skies and minimal humidity maximize solar capture.
-
Sindh averages 5.5-6.5 kWh/m²/day with particularly strong resources in Thar and upper Sindh districts.
-
Punjab receives 5-6 kWh/m²/day, slightly lower due to winter fog and monsoon clouds but still excellent by global standards.
-
Khyber Pakhtunkhwa averages 4.5-5.5 kWh/m²/day, lower in northern valleys but strong in southern districts.
Even Pakistan’s lowest-resource areas outperform most European locations. This abundant sunshine translates directly into higher solar system productivity and faster investment returns for Pakistani farmers.
Perfect Climate Alignment
Pakistan's hottest, sunniest months coincide precisely with peak agricultural energy demands. When crops need water most urgently, solar panels produce maximum power. This natural alignment eliminates the production-demand mismatch that challenges solar systems in other climates.
Consider the monthly pattern:
-
May-July: Peak sunshine and peak irrigation demand align perfectly. Solar systems produce maximum output precisely when tube wells must run the longest.
-
August-September: Monsoon clouds reduce solar production but rainfall also reduces irrigation needs. The alignment continues.
-
October-March: Reduced sunshine coincides with reduced irrigation for most crops. Winter wheat requires less frequent irrigation than summer crops, matching lower solar production.
This seasonal synchronization means Pakistani agricultural solar systems require less battery storage than systems in climates where production and demand patterns diverge. Simpler, more affordable system configurations achieve the same results.
Declining Technology Costs Create Opportunity
Solar technology costs have plummeted dramatically, transforming economics for Pakistani farmers. Consider the price trajectory:
-
2010: Rs. 200+ per watt for solar panels
-
2015: Rs. 100-120 per watt
-
2020: Rs. 50-70 per watt
-
2024: Rs. 35-55 per watt
Complete agricultural solar systems that once cost Rs. 30-40 lakhs now install for Rs. 10-15 lakhs. This cost revolution brings solar within reach of medium and even small farmers who could never have afforded earlier technology.
Simultaneously, panel efficiency has improved. Modern panels produce 20-22% more power per square meter than panels from a decade ago. Farmers get more energy from less space at lower cost—a triple advantage accelerating adoption.
Growing Local Industry
Pakistan’s domestic solar industry has matured significantly, ensuring equipment availability and service support. Pakistani companies now manufacture solar panels that meet international quality standards. Local inverter assembly reduces costs while ensuring parts availability. Experienced installers understand agricultural applications and provide reliable service.
This domestic capability offers multiple advantages:
-
Reduced costs: Local manufacturing and assembly eliminate import logistics expenses and reduce foreign exchange requirements.
-
Faster delivery: Equipment availability from domestic sources prevents project delays from international shipping complications.
-
Better service: Local companies provide warranty service, maintenance support, and technical assistance that international suppliers cannot match.
-
Employment creation: Solar industry growth creates rural jobs in installation, maintenance, and support services.
The industry's development creates a virtuous cycle more installations create more expertise, which enables better installations, which builds confidence for more adoption.
Understanding Your Farm's Energy Profile
Successful solar integration requires thoroughly understanding your specific energy consumption patterns. This foundation ensures your solar system matches actual needs rather than assumptions or generic estimates.
Conducting a Comprehensive Energy Audit
Begin by gathering concrete data about your current energy use. This isn't guesswork it’s systematic analysis that guides every subsequent decision.
-
Collect 12-24 months of electricity bills if grid-connected. Record monthly consumption in kilowatt-hours, noting seasonal patterns. Identify which months show the highest consumption and correlate with agricultural activities irrigation seasons, harvest processing, livestock requirements.
-
For diesel-powered operations, track fuel purchases over a full year. Record liters consumed monthly and correlate with farm activities. Calculate energy equivalent one liter of diesel in a generator produces approximately 3-4 kWh of electricity, though efficiency varies.
-
Document operating schedules for major equipment. When does your tube well run? How many hours daily during peak irrigation? How does this change across seasons? What other equipment operates simultaneously?
Categorizing Agricultural Energy Uses
Breaking down consumption by category reveals priorities and opportunities:
-
Irrigation and Water Pumping typically dominates agricultural energy consumption, often representing 60-80% of total farm electricity use. A 10-horsepower submersible pump draws approximately 7.5 kW, consuming 45 kWh during six hours of daily operation. Larger tube wells serving extensive acreage consume proportionally more.
-
Crop Processing Equipment such as threshers, winnowers, grain dryers, and grinding mills consume significant power during harvest seasons. These loads may be intermittent but intense. A wheat thresher might draw 15-20 kW but operate only during harvest weeks.
-
Fodder and Feed Preparation equipment serves livestock operations. Chaff cutters typically draw 2-5 kW depending on capacity. Feed mixing and grinding equipment may require 5-10 kW. These loads often operate daily year-round.
-
Cold Storage and Refrigeration requires continuous power, making reliability critical. Small cold rooms consume 10-30 kWh daily depending on size, insulation quality, and ambient temperatures. Milk chillers for dairy operations require similar continuous power.
-
Livestock Facility Requirements vary by operation type. Poultry houses need ventilation fans (often 5-20 kW total), lighting, and feeding systems. Dairy operations require milking machines, cooling equipment, and water heating. These loads may be critical—power failure in a poultry house during summer can kill thousands of birds within hours.
-
Residential and General Needs for farmhouse lighting, fans, refrigerators, televisions, and other appliances typically represent smaller loads than agricultural equipment but contribute to total requirements.
Calculating Total Daily Consumption
Sum all categorized loads to determine total daily energy requirements:
Example for a medium-sized Punjab mixed farm:
| Load Category | Power (kW) | Hours/Day | Daily kWh |
|---|---|---|---|
| Tube well (10 HP) | 7.5 | 6 | 45 |
| Chaff cutter | 3 | 2 | 6 |
| Farmhouse loads | 2 | 10 | 20 |
| Miscellaneous | 1 | 5 | 5 |
| Total | 76 kWh |
This calculation provides the foundation for system sizing. Your solar installation must produce at least this much energy on average on sunny days to meet farm needs.
Identifying Peak Demand
Total daily consumption differs from peak instantaneous demand. If your tube well, chaff cutter, and household air conditioner operate simultaneously, peak demand might reach 15-20 kW even though average hourly consumption is much lower.
Peak demand determines electrical infrastructure requirements—wire sizing, inverter capacity, and protection devices. Undersizing for peak demand causes system failures even when total capacity appears adequate.
Document which equipment operates simultaneously during normal farm operations. Identify the maximum combined load that might reasonably occur. Design systems to handle this peak with appropriate safety margins.
Types of Solar Systems for Pakistani Farms
Different solar configurations suit different Pakistani agricultural contexts. Understanding options helps match systems to your specific situation.
On-Grid Solar Systems
On-grid systems connect to WAPDA or K-Electric networks through net metering arrangements. Solar panels generate electricity that powers farm loads directly. When production exceeds consumption, excess flows to the grid, earning credits against future bills. When solar production falls short nights, cloudy periods, or high-demand times grid power supplements seamlessly.
Advantages:
-
Lower cost than off-grid systems since batteries aren’t required.
-
Grid backup provides power when solar is insufficient.
-
Net metering credits reduce or eliminate electricity bills.
-
Simpler system design and maintenance.
Disadvantages:
-
When load shedding occurs, on-grid systems shut down for safety (anti-islanding protection).
-
Grid dependency remains solar doesn’t solve load shedding problem.
-
Net metering bureaucracy can be challenging.
-
Grid connection fees and requirements apply.
Typical costs: Rs. 100,000-150,000 per kW installed
Best suited for: Farms with relatively reliable grid connection primarily seeking bill reduction rather than load shedding protection.
Off-Grid Solar Systems
Off-grid systems operate completely independently without utility connection. Battery banks store energy for use during nights, cloudy periods, or when demand exceeds instantaneous solar production. These systems provide complete energy independence no load shedding impact, no electricity bills, and no grid dependency whatsoever.
Advantages:
-
Complete independence from grid and load shedding.
-
Zero electricity bills permanently.
-
Operates in remote areas without grid access.
-
Full control over energy supply.
Disadvantages:
-
Higher cost due to battery requirements.
-
Batteries require maintenance and periodic replacement.
-
System sizing must cover all needs, including worst-case scenarios.
-
No grid backup if solar/battery capacity is insufficient.
Typical costs: Rs. 180,000-300,000 per kW installed (including batteries)
Best suited for: Remote farms without grid access, areas with severe load shedding, operations requiring guaranteed uninterrupted power.
Hybrid Solar Systems
Hybrid systems combine grid connection with battery backup, offering advantages of both approaches. During normal operation, they function like on-grid systems solar powers loads, excess goes to the grid, and the grid supplements when needed. When load shedding occurs, batteries automatically provide power for critical loads.
Advantages:
-
Grid connection reduces battery requirements and costs.
-
Battery backup protects against load shedding.
-
Net metering benefits when the grid is available.
-
Flexibility to prioritize loads during outages.
Disadvantages:
-
More complex than either pure on-grid or off-grid systems.
-
Higher cost than on-grid (though less than full off-grid).
-
Requires sophisticated inverter/controller systems.
-
Battery maintenance and replacement still required.
Typical costs: Rs. 150,000-250,000 per kW installed
Best suited for: Farms with grid connection but frequent load shedding, operations with critical loads requiring backup protection.
Solar Tube Well Systems (Direct Pumping)
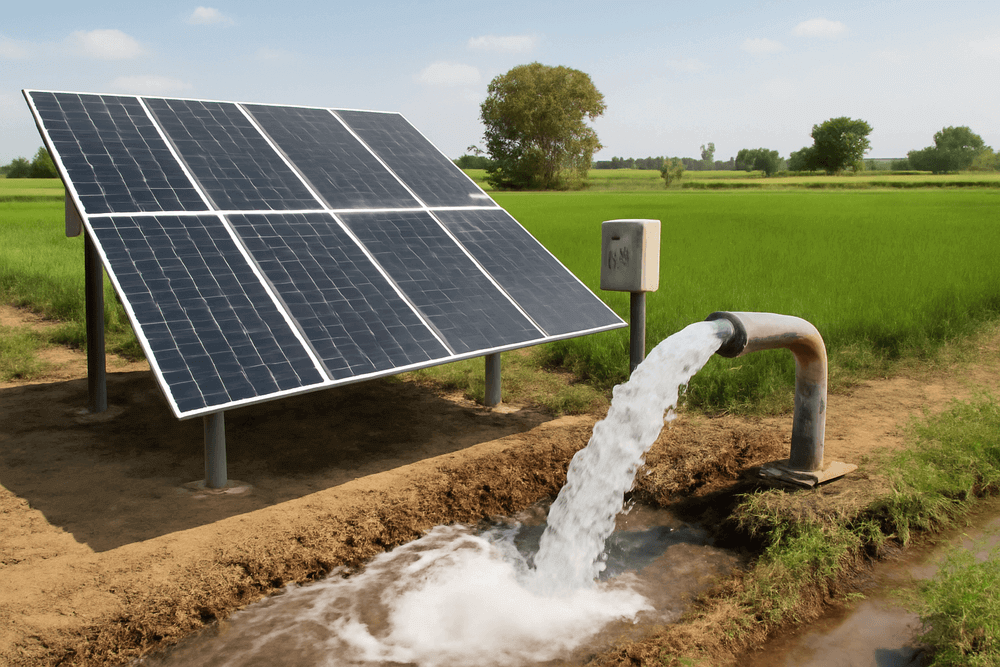
Solar tube well systems directly power water pumps without batteries or grid connection. Specialized solar pump inverters (Variable Frequency Drives or VFDs) convert panel output to run submersible or surface pumps. These systems operate only when sufficient sunshine exists typically 6-8 hours daily during peak months.
Advantages:
-
Lowest cost per kilowatt for irrigation applications.
-
Simplest system design with fewest components.
-
Minimal maintenance requirements.
-
No battery costs or replacement.
-
Water storage replaces electrical storage more economically.
Disadvantages:
-
Pumping only occurs during sunshine hours.
-
Cloudy days significantly reduce water production.
-
Cannot power non-pumping loads without modification.
-
Requires water storage strategy for non-daylight irrigation needs.
Typical costs: Rs. 80,000-130,000 per kW installed
Best suited for: Irrigation applications where daytime pumping with water storage meets requirements, farms prioritizing the lowest cost for water extraction.
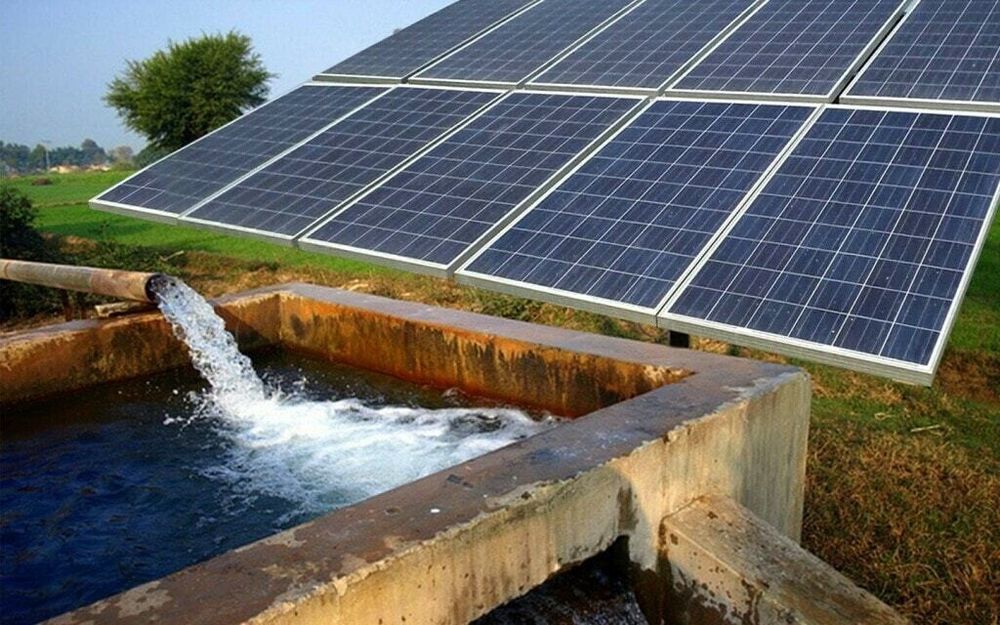
Solar Tube Wells: Pakistan's Agricultural Revolution
Solar-powered tube wells have transformed Pakistani irrigation more than any other solar application. Their dramatic economics and operational benefits explain why adoption has accelerated rapidly across agricultural regions.
Understanding Solar Tube Well Economics
The financial case for solar tube wells is overwhelming when compared to conventional alternatives.
Comparison with Diesel Pumping:
Consider a farmer currently operating a 10-horsepower diesel tube well:
-
Diesel consumption: 3.5 liters per hour
-
Fuel cost at Rs. 310/liter: Rs. 1,085/hour
-
Daily operating cost (6 hours): Rs. 6,510
-
Monthly cost (25 operating days): Rs. 162,750
-
Annual cost (5-month irrigation season): Rs. 813,750
A solar tube well system for the same application costs approximately Rs. 900,000-1,300,000 installed. Comparing: -
Solar system cost: Rs. 1,100,000 (typical)
-
Annual diesel savings: Rs. 813,750
-
Simple payback period: 1.35 years (approximately 16 months)
After payback, the farmer essentially irrigates for free for the system's remaining 20+ year lifespan. Cumulative savings over 25 years exceed Rs. 20,000,000 transformative wealth for any farming family.
Comparison with Grid Electricity:
For grid-connected tube wells, the economics remain compelling:
-
Electricity consumption: 7.5 kW × 6 hours = 45 kWh daily
-
Cost at Rs. 32/unit: Rs. 1,440/day
-
Monthly cost: Rs. 36,000
-
Annual cost: Rs. 432,000
Solar system cost: Rs. 1,100,000
Annual electricity savings: Rs. 432,000
Simple payback period: 2.5 years
Beyond direct savings, solar eliminates load shedding losses. If load shedding reduces effective irrigation by 30%, yield losses may exceed Rs. 200,000 annually. Including avoided losses, effective payback shortens to under 2 years.
System Components and Specifications
A complete solar tube well system includes several integrated components:
-
Solar Panels generate DC electricity from sunlight. For a 10-horsepower (7.5 kW) tube well, systems typically include 12-18 panels depending on individual panel wattage. Modern 550-600W panels reduce panel count and mounting complexity compared to older, lower-wattage panels.
Panel selection criteria:-
Monocrystalline preferred for higher efficiency and heat tolerance.
-
Reputable manufacturers with verifiable warranties.
-
Temperature coefficient below -0.4%/°C for Pakistani heat conditions.
-
Positive power tolerance ensuring rated output.
-
-
Solar Pump Inverter (VFD) converts DC panel output to AC power suitable for pump motors. Unlike standard inverters, solar pump inverters/VFDs specifically optimize pump operation across varying solar input levels. Key features include:
-
Maximum Power Point Tracking (MPPT) extracting maximum energy from panels.
-
Soft start reducing motor stress and extending pump life.
-
Dry run protection preventing pump damage when water levels drop.
-
Variable speed operation matching pump output to available solar power.
Quality VFDs from manufacturers like ABB, Schneider, Invt, or Sofar ensure reliable long-term operation.
Pricing: Rs. 100,000-180,000 for a quality VFD appropriate for 10-15 HP systems.
-
-
Submersible Pump designed for solar compatibility operates efficiently across varying power inputs. Solar-rated pumps feature:
-
High-efficiency motors maximizing water output per kilowatt.
-
Variable speed capability matching VFD output.
-
Robust construction tolerating frequent start/stop cycles.
-
Appropriate lift capacity for your water table depth.
Pump selection must match your specific conditions water table depth, required flow rate, pipe diameter, and discharge height. Oversized pumps waste money while undersized pumps fail to meet irrigation needs.
-
-
Mounting Structure holds panels at optimal angles facing south (in Pakistan's northern hemisphere location). Options include:
-
Fixed ground mounts: Most common and economical, set at an optimal annual angle (typically 25-35° from horizontal).
-
Adjustable mounts: Allow seasonal angle changes for optimized production.
-
Elevated structures: Provide shade for equipment or work areas beneath.
-
Tracking systems: Follow the sun for 15-25% more production but add cost and complexity.
For most Pakistani tube well installations, fixed ground mounts at 30° tilt provide the best value.
-
-
Wiring and Protection complete the system. DC cables from panels to inverters must be properly sized to minimize power losses. Protection devices, including DC disconnects, surge protectors, and fuses, ensure safe operation. Quality installation materials prevent failures that disable entire systems.
Performance Expectations
Realistic performance expectations prevent disappointment and enable proper planning.
-
Daily Production Pattern: Solar tube wells pump maximum water during midday hours when sunshine intensity peaks. The typical daily pattern is:
-
7-9 AM: System starts, ramping up as sunshine increases; pumping at 30-60% capacity.
-
9 AM-4 PM: Peak production period; pumping at 70-100% capacity.
-
4-6 PM: Declining production as sunshine wanes; pumping at 30-60% capacity.
-
6 PM-7 AM: No pumping (insufficient light).
Total effective pumping time typically reaches 6-8 hours during summer months, and 4-6 hours during winter.
-
-
Seasonal Variation: Summer months (April-September) provide maximum production longest days combined with most direct sunshine. Winter months produce 40-60% less due to shorter days and lower sun angles. This seasonal pattern generally aligns with agricultural water demands.
-
Weather Impacts: Cloudy days reduce production significantly heavy overcast may cut output to 20-30% of clear-day production. Dust accumulation gradually reduces output until panels are cleaned. Proper maintenance maintains optimal performance.
-
Annual Water Production: A well-designed 10 HP solar tube well system in Punjab typically pumps 150,000-250,000 gallons daily during peak season, translating to 20-40 million gallons annually, depending on operating conditions and water table depth.
Water Storage Integration
Since solar pumping occurs only during sunshine hours, water storage bridges the gap between production timing and irrigation needs.
-
Elevated Storage Tanks provide pressurized delivery through gravity. Tanks mounted 15-30 feet high enable drip or sprinkler irrigation without additional pumping. Initial costs are higher, but operational simplicity and efficiency gains justify investment for precision irrigation systems.
Typical costs: Rs. 50,000-150,000 for 5,000-20,000 liter capacity elevated tanks. -
Ground-Level Reservoirs store larger volumes at lower costs. Lined ponds or concrete tanks hold water pumped during daytime for evening or early morning irrigation. Surface storage requires secondary pumping for pressurized irrigation but enables larger storage volumes economically.
Typical costs: Rs. 100,000-300,000 for 50,000-200,000 liter reservoirs. -
Soil Moisture Reservoir Strategy uses the soil itself as storage. Irrigate thoroughly during peak solar production, saturating root zones. Soil holds moisture for plant uptake over subsequent days, reducing irrigation frequency. This approach works well for flood irrigation and less water-sensitive crops.
Site Assessment for Pakistani Conditions
Proper site assessment ensures solar systems perform optimally in Pakistan's specific environmental conditions extreme heat, dust, humidity variations, and voltage fluctuations.
Evaluating Solar Access
Identify locations receiving unobstructed sunshine throughout the day. Survey proposed installation areas, noting shadows from:
-
Trees: Existing trees and projected growth over the system’s lifetime.
-
Buildings: Farmhouses, sheds, barns, and planned structures.
-
Tube well infrastructure: Elevated tanks, pump houses, and equipment.
-
Utility poles and lines: Overhead wires and support structures.
-
Neighboring properties: Adjacent buildings or trees that may create shadows.
Remember, sun angles change seasonally. Winter sun tracks lower across the southern sky, creating longer shadows than in summer. A location clear in June may receive significant shading in December. Evaluate shade patterns across seasons before finalizing locations.
Even partial shading dramatically reduces panel output. A shadow covering 10% of a panel can reduce output by 50% or more due to how panel cells interconnect. Locate systems where complete, year-round solar access is assured.